Introduction: Stable Cash Flow Through Options Selling
🙏 Special Thanks
Thanks to Ross for summarizing his valuable experience using QuantMind indicators and sharing the Sell Put/Put Spread strategy for achieving stable cash flow income. Ross has validated the effectiveness of this strategy system through long-term practice, and his systematic methodology and risk management framework provide extremely valuable reference for options traders.
"Sell Puts when the market is in extreme panic, let mean reversion work for you" — Ross
Why Choose Put Spread Strategy?
- 📊 Cash Flow Creation: Direct purpose is to create passive income
- 💰 Cost Basis Reduction: If willing to be assigned, it's like "buying stocks at a discount"
- 🛡️ Controlled Risk: Spreads limit maximum loss and significantly reduce margin requirements
- 📈 High Win Rate: Combined with QuantMind indicators, win rate can exceed 80%
⚠️ Key Misconception Correction
Many people think selling options requires large capital - this is a misunderstanding! Put Spreads reduce margin requirements by 80%+ through buying lower strike Puts as protection, allowing small accounts to participate in options selling strategies.
QuantMind's Five Core Indicators
🌊 CycleWave Pro MTF
Precisely captures market momentum cycles and extreme reversal points. Multi-timeframe resonance analysis provides high-probability entry signals.
Signal Accuracy: 95%📊 Market Structure & Volume
Analyzes core price structures and volume support/resistance zones for precise key level identification.
Support Identification: 90%💎 Smart Money Flow Analysis
Tracks institutional "smart money" intentions. Extreme signals are excellent reversal entry points.
Institution Tracking: 92%📈 Trend Strength Analyzer
Quantifies multi-timeframe trend strength and direction, ensuring trading in the right market environment.
Trend Recognition: 88%📉 VWAP & Bollinger Bands
Locates statistically significant key price levels, providing precise support/resistance references.
Price Precision: 85%Strategy Fundamentals: The Three Friends of Option Sellers
Option Seller's Profit Formula
Put sellers profit when: Stock rises (Δ+), Time passes (Θ+), Volatility drops (V-)
Put Spread vs Naked Put Comparison
| Comparison Item | Naked Put | Put Spread | Winner |
|---|---|---|---|
| Margin Requirement | $8,000-12,000 | $1,000-2,000 | ✅ Put Spread |
| Max Loss | Unlimited (stock to zero) | Limited (spread width) | ✅ Put Spread |
| Premium Income | Higher | Moderate | ✅ Naked Put |
| Capital Efficiency | Low | High | ✅ Put Spread |
| Psychological Stress | High | Low | ✅ Put Spread |
Stock Selection Framework: Three Core Criteria
Large Cycle Trend Confirmation
Use TSA (Trend Strength Analyzer) to confirm daily trend:
- ✅ TSA > 0 and showing green: Uptrend, suitable for selling Puts
- ✅ TSA oscillating between -20 and +20: Consolidation, sell Puts cautiously
- ❌ TSA < -20 and showing red: Downtrend, avoid selling Puts
High Implied Volatility Environment
Look for "opportunities falling from the sky" - IV Rank > 50%:
- IV expansion periods around earnings
- IV spikes due to market panic
- Volatility increases from stock-specific events
Fundamental Support
Choose quality stocks you're willing to own:
- Stable cash flow and profitability
- Reasonable valuation levels (don't chase highs)
- Industry leaders with solid positions
- Technical patterns with clear support levels
Entry Timing: Multi-Timeframe Resonance for Extreme Capture
🎯 QuantMind Indicators in Action
📈 TSA Trend Strength Analyzer - Mean Reversion Trading
TSA is based on mean reversion theory. When the indicator shows extreme oversold conditions, prices tend to revert to the mean - this is the perfect time to sell Puts!
- Extreme Oversold (TSA < -80): 🎯 BEST Put selling opportunity! Market overly pessimistic, high rebound probability
- Oversold Zone (-80 < TSA < -40): Prepare to enter, wait for other indicator confirmation
- Normal Zone (-40 < TSA < 40): Market in equilibrium, watch and wait
- Overbought Zone (TSA > 40): Strong trend, but not a good time for new Puts
🔑 Core Strategy: When TSA drops below -80 forming extreme oversold, combined with SMFA "EXT-" signal and CycleWave "BUY!" signal, the triple-confirmed mean reversion trade has over 90% success rate. Remember: Sell Puts during extreme panic, let mean reversion work for you!
💎 SMFA Smart Money Flow Analysis
🌊 CycleWave Pro MTF
- Oversold Zone (Green): Indicator value < -80, potential rebound zone
- "BUY!" Signal: Reversal confirmation after extreme oversold
- Bullish Divergence: Price makes new low but indicator doesn't - strong reversal signal
Three-Step Entry Method
Find Extreme Oversold Signals
SMFA shows "Extreme Bearish (EXT-)":
- Remember: SMFA extreme signals are reversal signals
- EXT- indicates smart money is extremely bearish, often a bottom signal
CycleWave Pro confirms oversold:
- Shows "BUY!" signal
- Or forms bullish divergence (price new low, indicator doesn't)
Confirm Multi-Timeframe Resonance
Single timeframe signals may have "noise", multi-timeframe resonance greatly increases success rate:
| Timeframe | SMFA Signal | CycleWave Signal | Resonance Strength |
|---|---|---|---|
| 15-minute | EXT- | BUY! | ⭐⭐⭐ |
| 1-hour | Bearish | Oversold Zone | ⭐⭐ |
| 4-hour | EXT- | Bullish Divergence | ⭐⭐⭐ |
✅ When 3 timeframes all show oversold/reversal signals, reliability exceeds 90%
Combine Price Structure for Strike Selection
Using Market Structure & Volume Distribution indicator:
- Identify nearest key support level
- Set Short Put strike below support
- Set Long Put 10-20 points lower
- Core principle: Don't be greedy when selecting strikes
Strike Selection: Option Chain Deep Analysis
Key Option Chain Indicators
🛡️ Put Wall
Largest Put open interest position in the option chain, typically forms strong support. Price rarely breaks below this level.
🔄 Dealer Gamma Flip
Price point where dealers flip from positive to negative Gamma. Market stable above, volatile below.
🎯 Max Pain
Price where option buyers suffer maximum loss at expiration. Stock price tends to "magnetize" to this level.
Strike Selection Formula
Choose the most conservative of the three for safety margin
Three Strategy Approaches Comparison
| Strategy Type | Short Put | Long Put | Max Profit | Max Loss | Win Rate | Suitable For |
|---|---|---|---|---|---|---|
| Conservative | Put Wall - 15 | -10 points | $200 | $800 | 85% | Beginners/Conservative |
| Balanced | Max Pain | -10 points | $350 | $650 | 70% | Experienced |
| Aggressive | Put Wall | -20 points | $500 | $1500 | 55% | Risk Seekers |
Risk Management: Three-Layer Protection System
Option 1: Overall Position Stop Loss
The simplest and most direct risk control method:
- Set stop loss line: Loss reaches 1.5-2x premium collected
- Example: Collect $300 premium, stop loss at $450-600 loss
- Pros: Simple execution, controlled risk
- Cons: May stop out before quick market rebound
Option 2: Rolling Down
Adjustment strategy when stock approaches Short Put:
Suitable scenario: Market oversold short-term but bullish long-term
Option 3: Leg Management (High Risk)
When stock breaks below Long Put strike:
- Close profitable Long Put (deep in the money)
- Keep losing Short Put
- Use Long Put profit to cover part of Short Put loss
- Wait for stock rebound or expiration
Risk: Converts to Naked Put, may face huge losses
📊 Risk Management Golden Rules
- Single trade risk not exceeding 2-3% of total capital
- Same underlying position not exceeding 10% of total capital
- Always set stop loss plan before entry
- Don't ignore risk for high premium
Case Study: TSLA Put Spread Analysis
📅 Trade Date: 2025-09-18 | Symbol: TSLA | Expiration: 2025-09-26 (8 days)
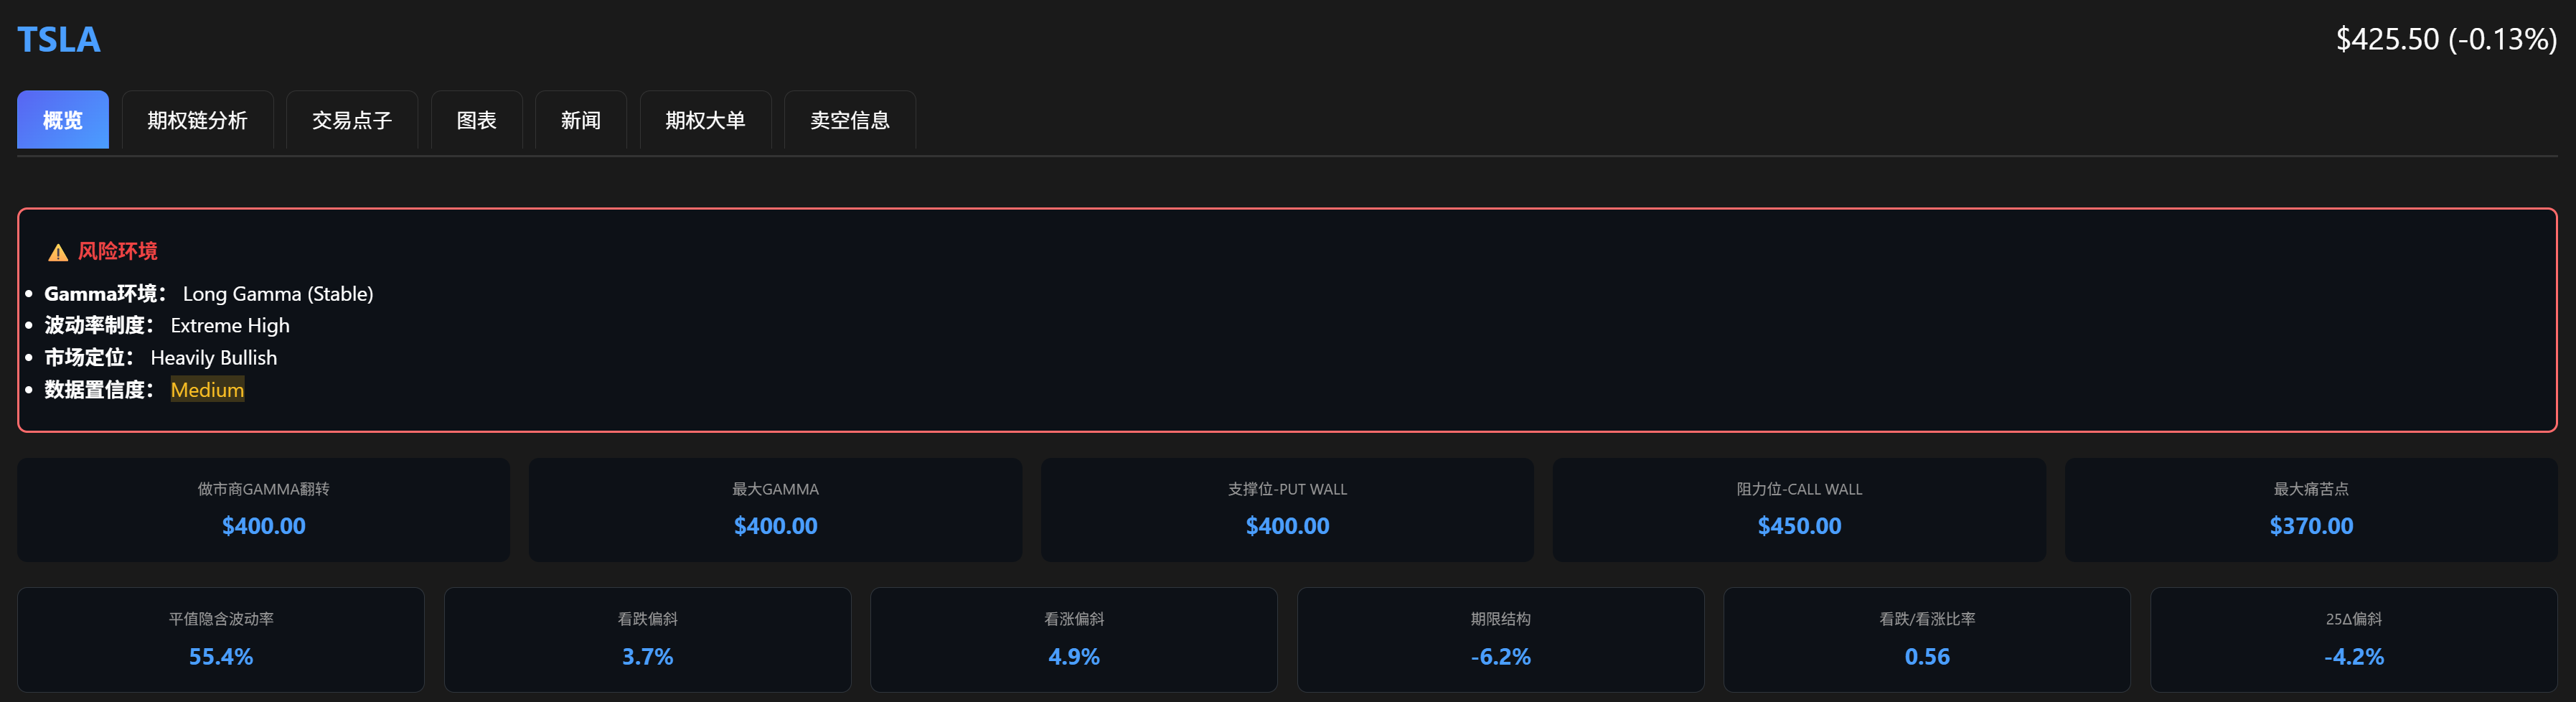
Market Environment Analysis
| Environment Indicator | Status | Meaning | Impact on Strategy |
|---|---|---|---|
| Gamma Environment | Long Gamma (Stable) | Dealers provide stability | ✅ Favorable |
| Volatility Regime | Extreme High | IV at extreme levels | ✅ Very Favorable |
| Market Positioning | Heavily Bullish | Market extremely bullish | ✅ Favorable |
| Current Price | $430 | - | - |
Key Option Chain Levels
| Indicator | Price Level | Importance | Description |
|---|---|---|---|
| Put Wall | $400 | ⭐⭐⭐⭐⭐ | Strongest support, massive Put concentration |
| Dealer Gamma Flip | $400 | ⭐⭐⭐⭐ | Volatility increases significantly below |
| Max Pain | $390 | ⭐⭐⭐ | Expiration price "magnet" |
| Next Support | $375 | ⭐⭐ | Secondary support below Put Wall |
Three Trading Approaches in Practice
Conservative Plan A: Safety First
- 💰 Premium Income: $110/contract
- 📊 Margin Required: $1,000
- 📈 Return: 11% (2 weeks)
- ✅ Win Rate: ~85%
- 📍 Safety Margin: 15 points from Put Wall
Suitable for: Beginners, risk-averse traders, small accounts
Balanced Plan B: Risk-Reward Balance
- 💰 Premium Income: $140/contract
- 📊 Margin Required: $1,000
- 📈 Return: 14% (2 weeks)
- ✅ Win Rate: ~70%
- 📍 Using Max Pain magnetism
Suitable for: Experienced traders, steady income seekers, medium accounts
Aggressive Plan C: High Risk High Reward
- 💰 Premium Income: $367/contract
- 📊 Margin Required: $2,000
- 📈 Return: 18.35% (2 weeks)
- ✅ Win Rate: ~55%
- 📍 Betting on Put Wall support
Suitable for: Aggressive traders, strong support believers, large accounts
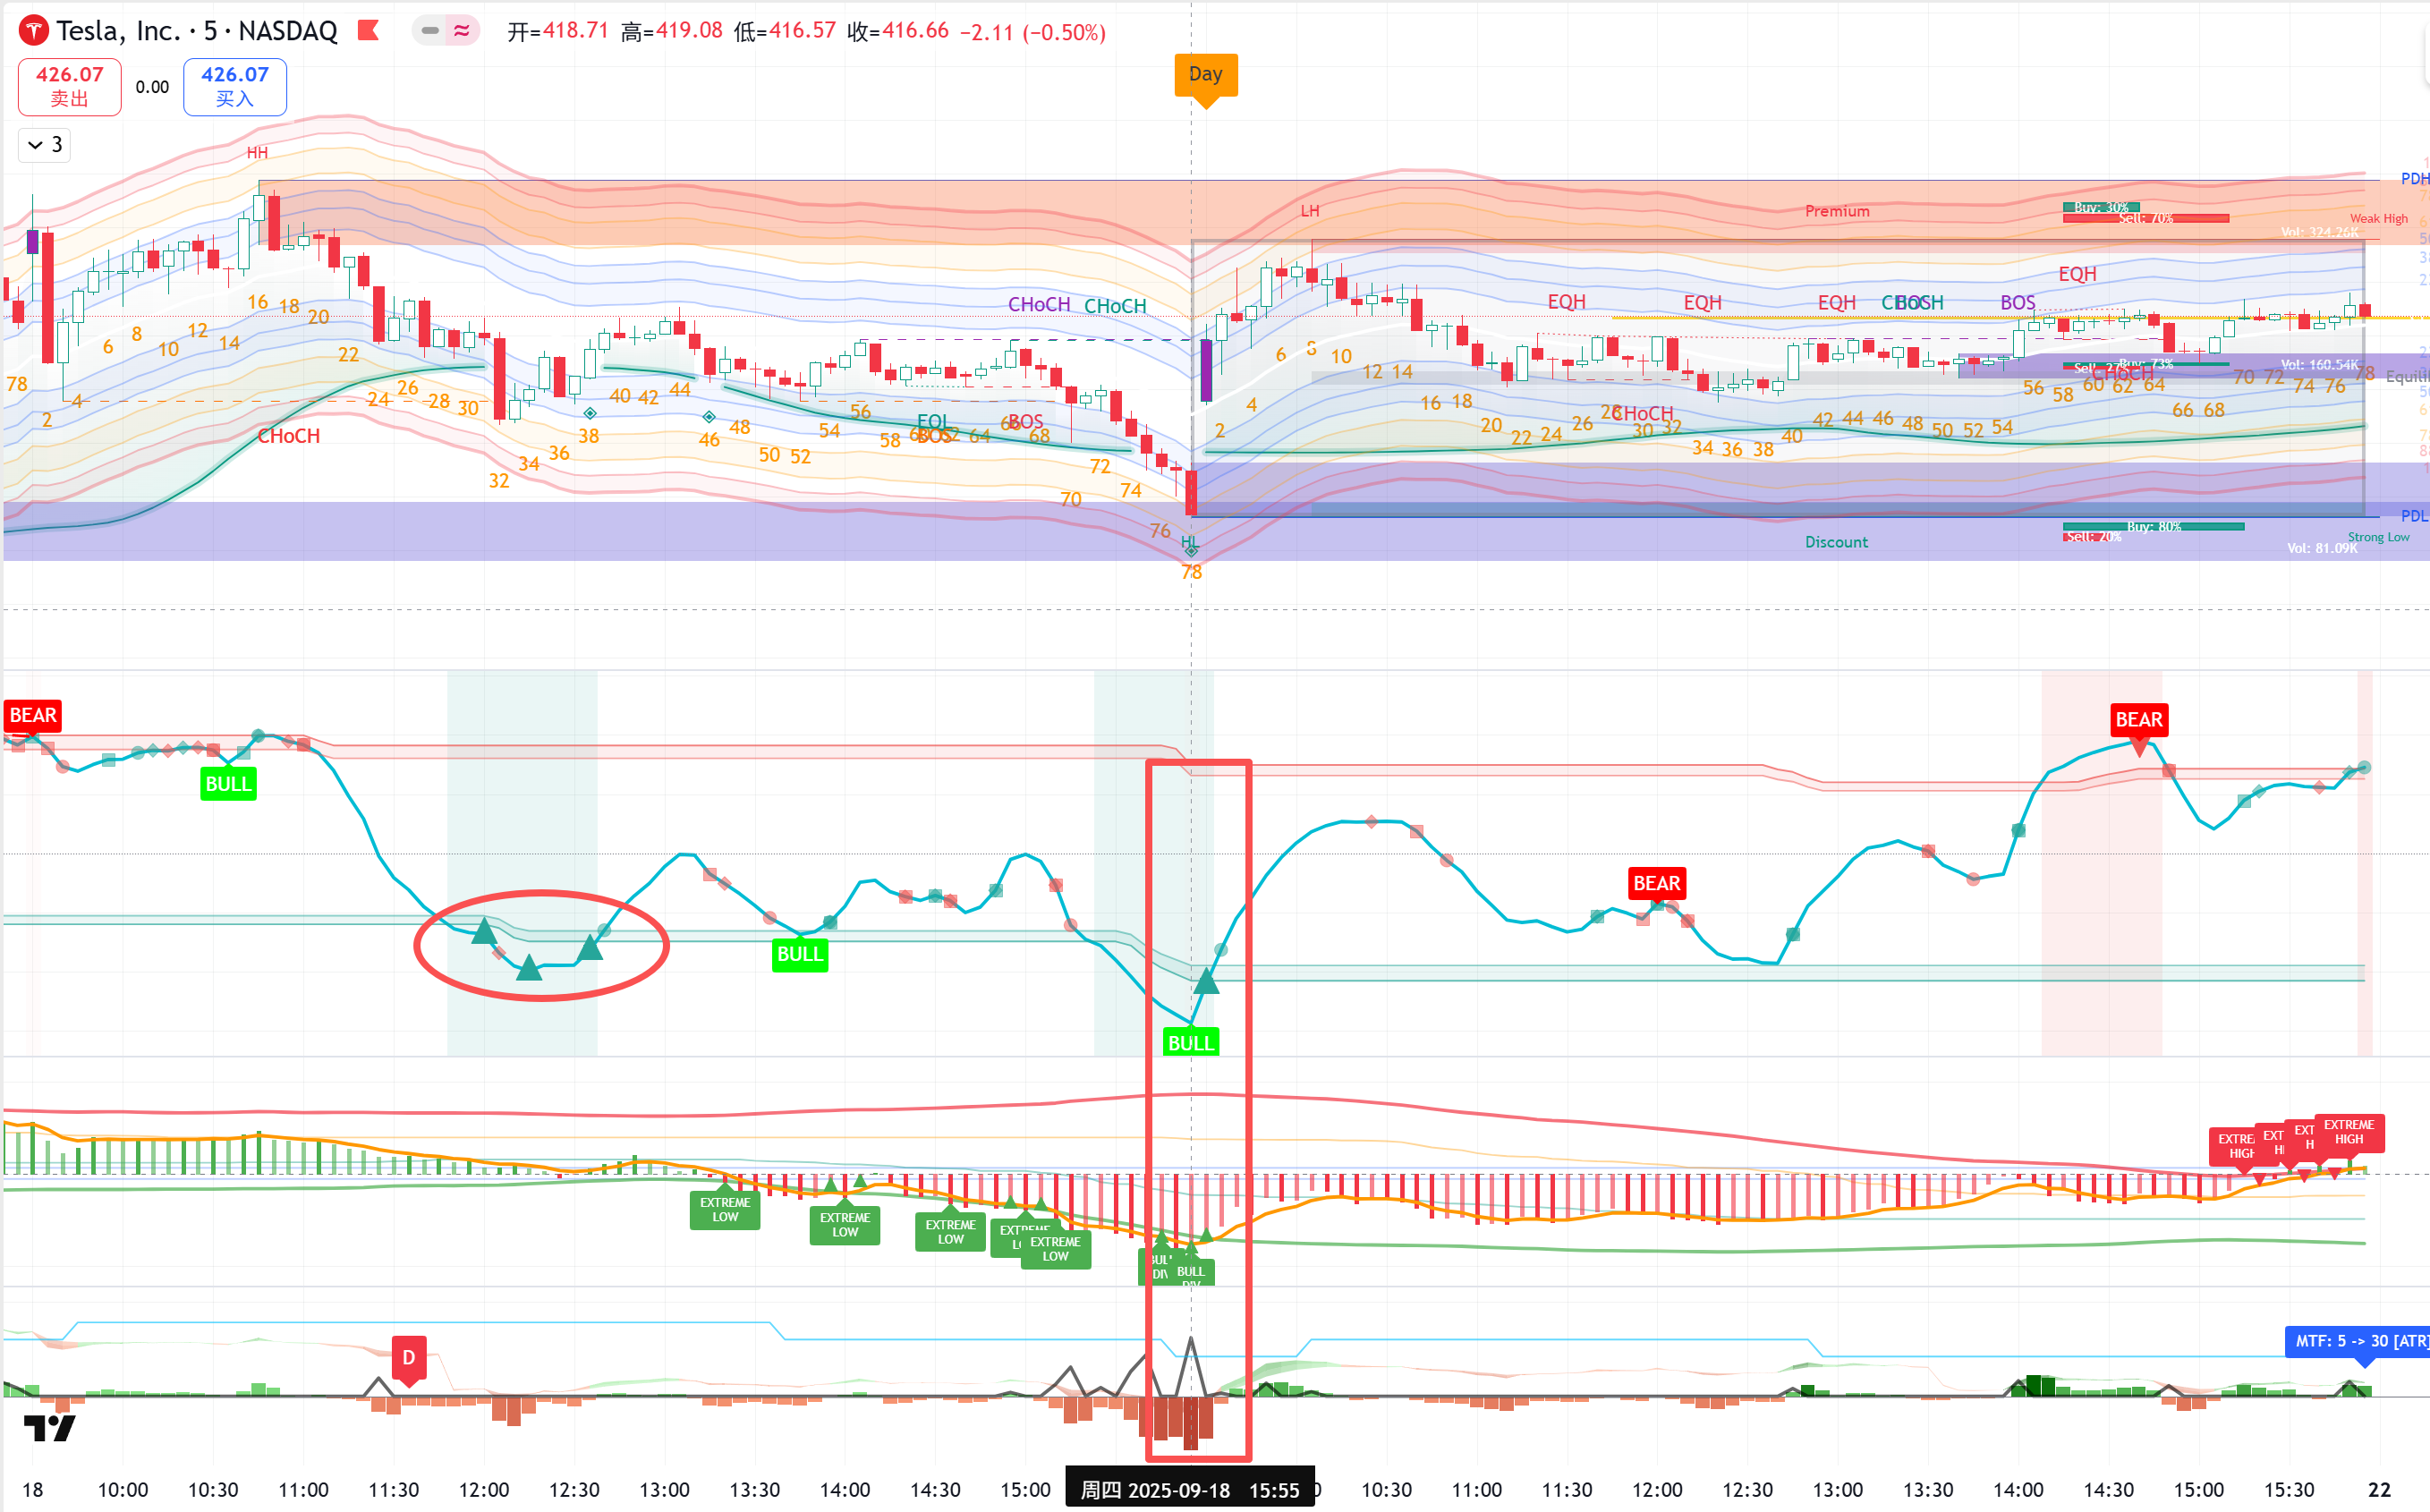
⏰ Entry Timing Comparison: Why Precise Entry Matters
📈 TSLA 5-Minute Chart (2025-09-18)
- Circle Characteristics: Only CycleWave in oversold, other indicators not confirmed
- Rectangle Characteristics:
- CycleWave forms bullish divergence (price new low, indicator doesn't)
- SMFA shows "EXT-" extreme oversold reversal signal
- TSA downward momentum bars visibly shortening, showing bear exhaustion
- Three major indicators simultaneously give "BUY" signals
Entry Timing Return Comparison
| Strategy Plan | Entry Time | Entry Price | Premium Income | Final P/L | Return Difference |
|---|---|---|---|---|---|
| Plan A (385/375) | 12:00 (Circle) | $428 | $95 | +$95 | -15.8% |
| 15:55 (Rectangle) | $425 | $110 | +$110 | ||
| Plan B (390/380) | 12:00 (Circle) | $428 | $115 | +$115 | -21.7% |
| 15:55 (Rectangle) | $425 | $140 | +$140 | ||
| Plan C (400/380) | 12:00 (Circle) | $428 | $285 | +$285 | -28.7% |
| 15:55 (Rectangle) | $425 | $367 | +$367 |
Conclusion: Waiting for multi-indicator resonance signals can increase premium income by 20-30% on average
📊 MSTR Case: The Power of Multi-Timeframe Resonance
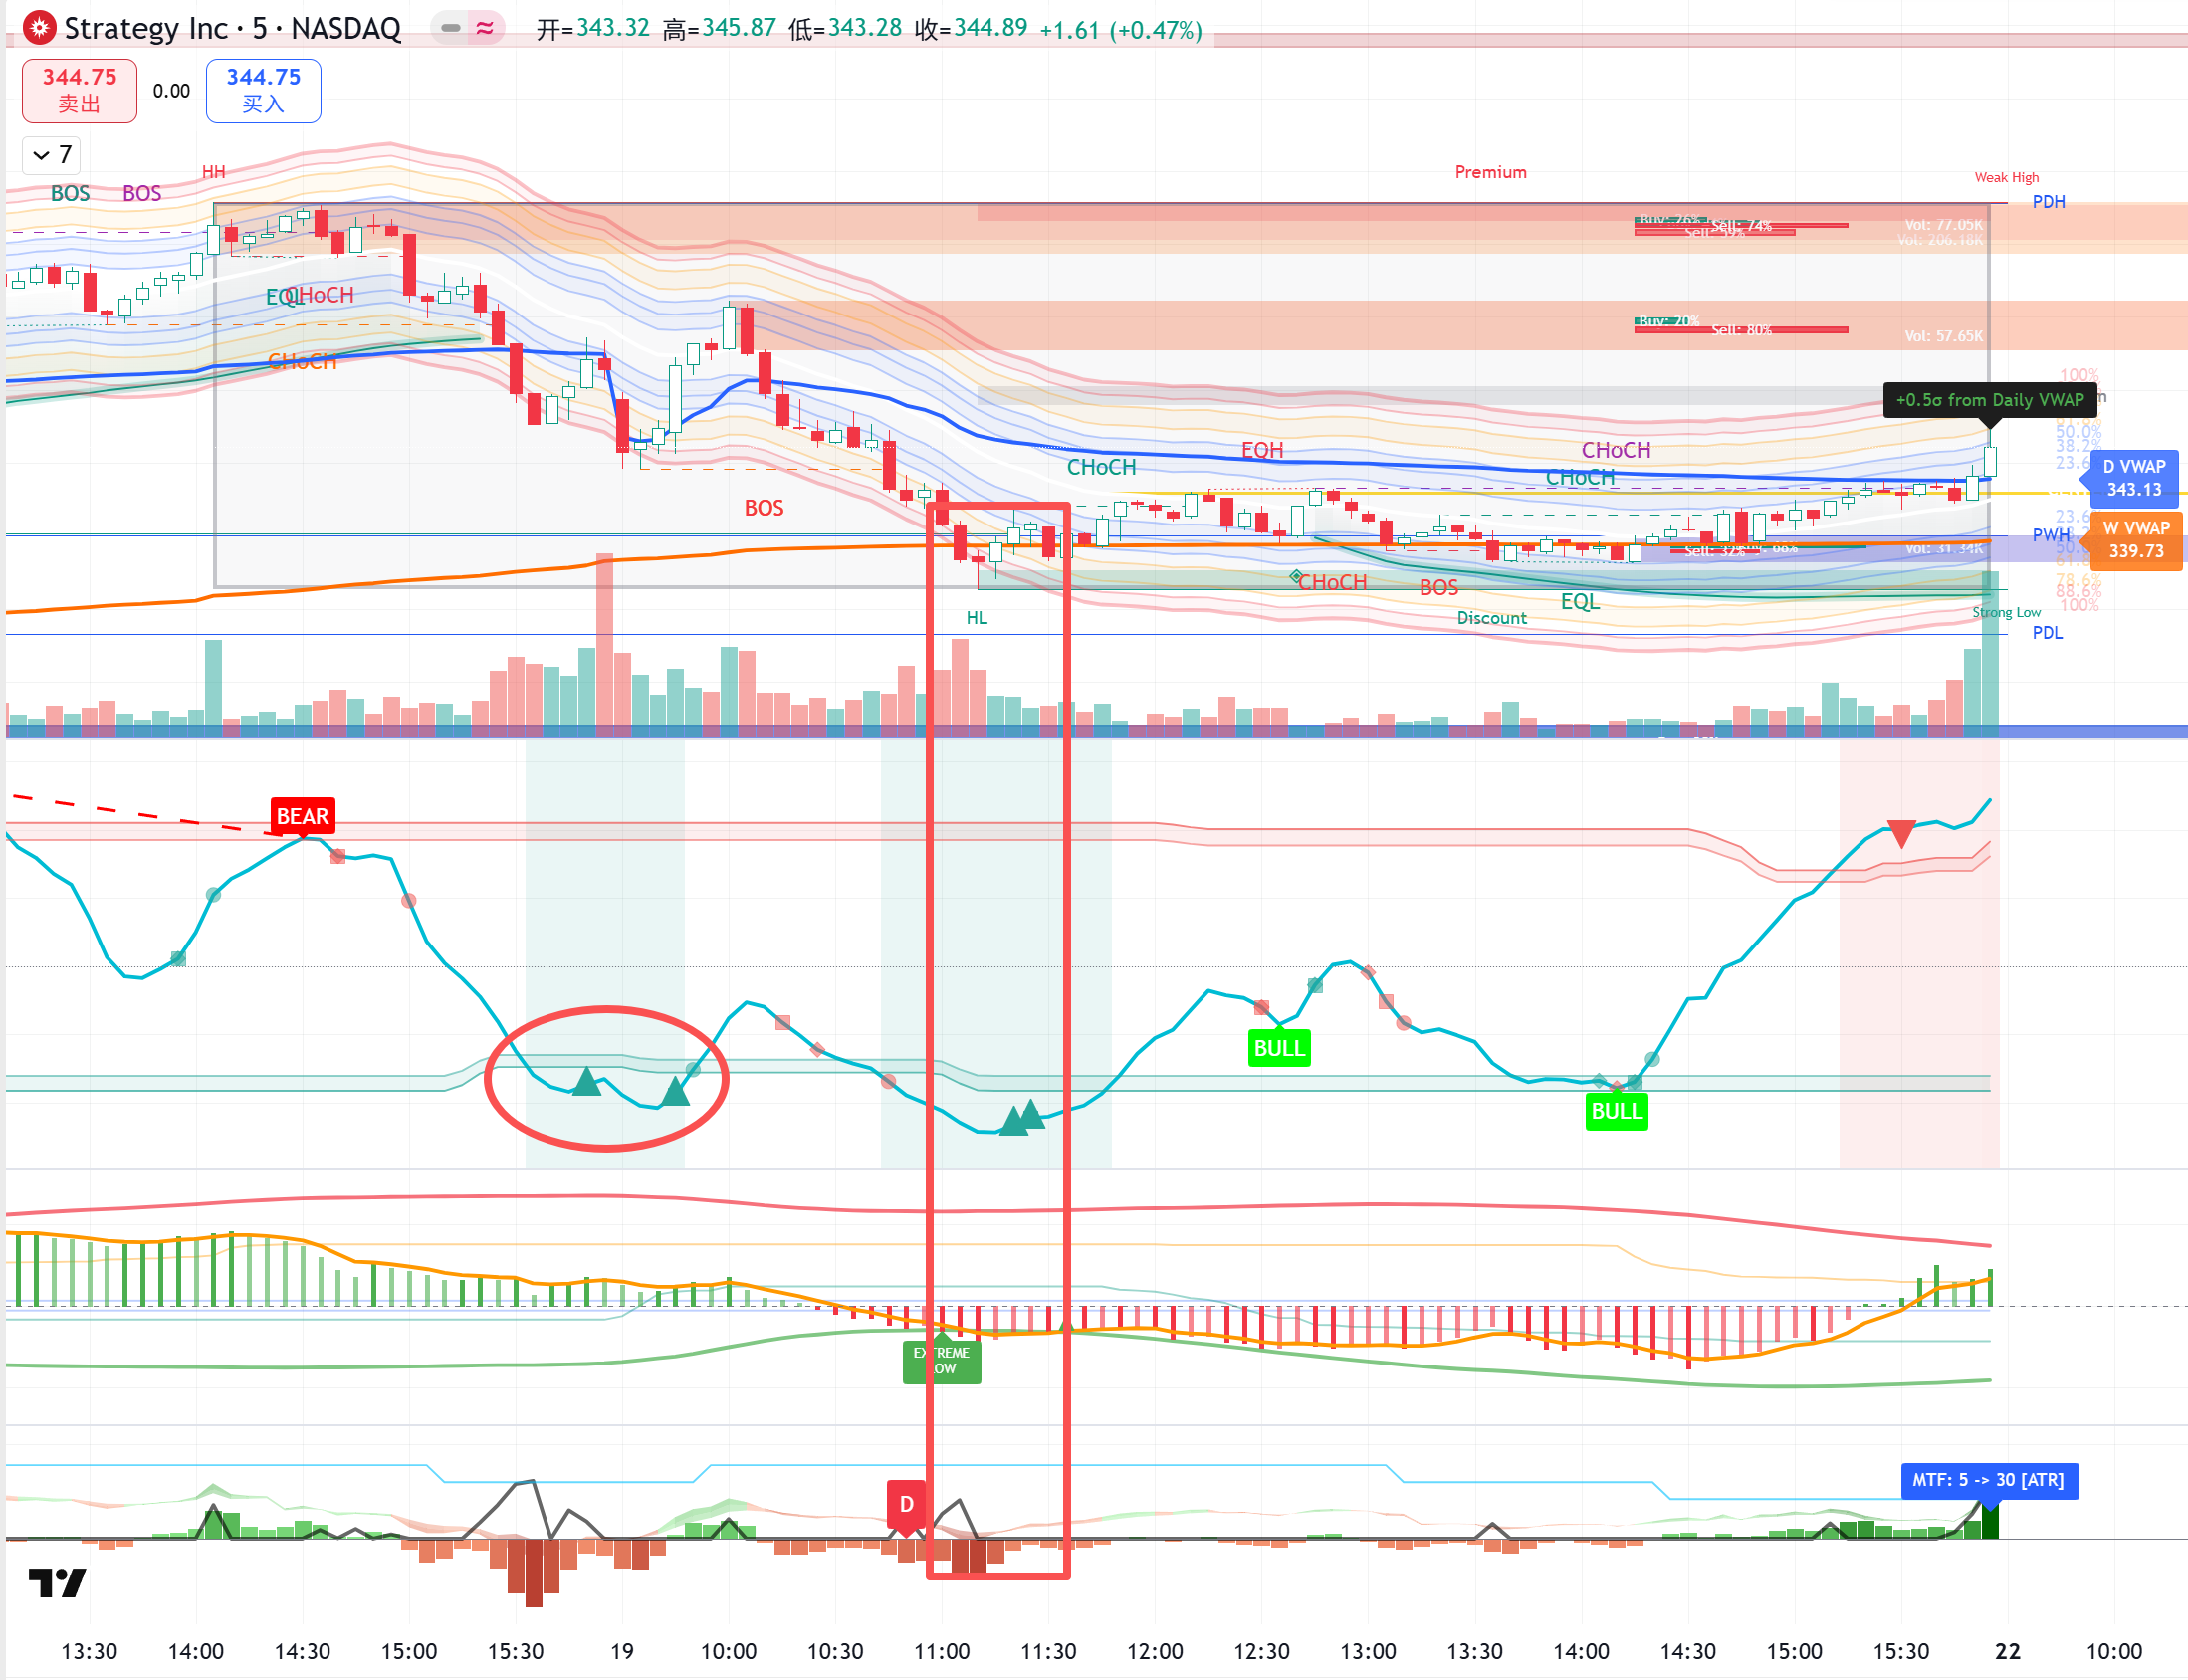
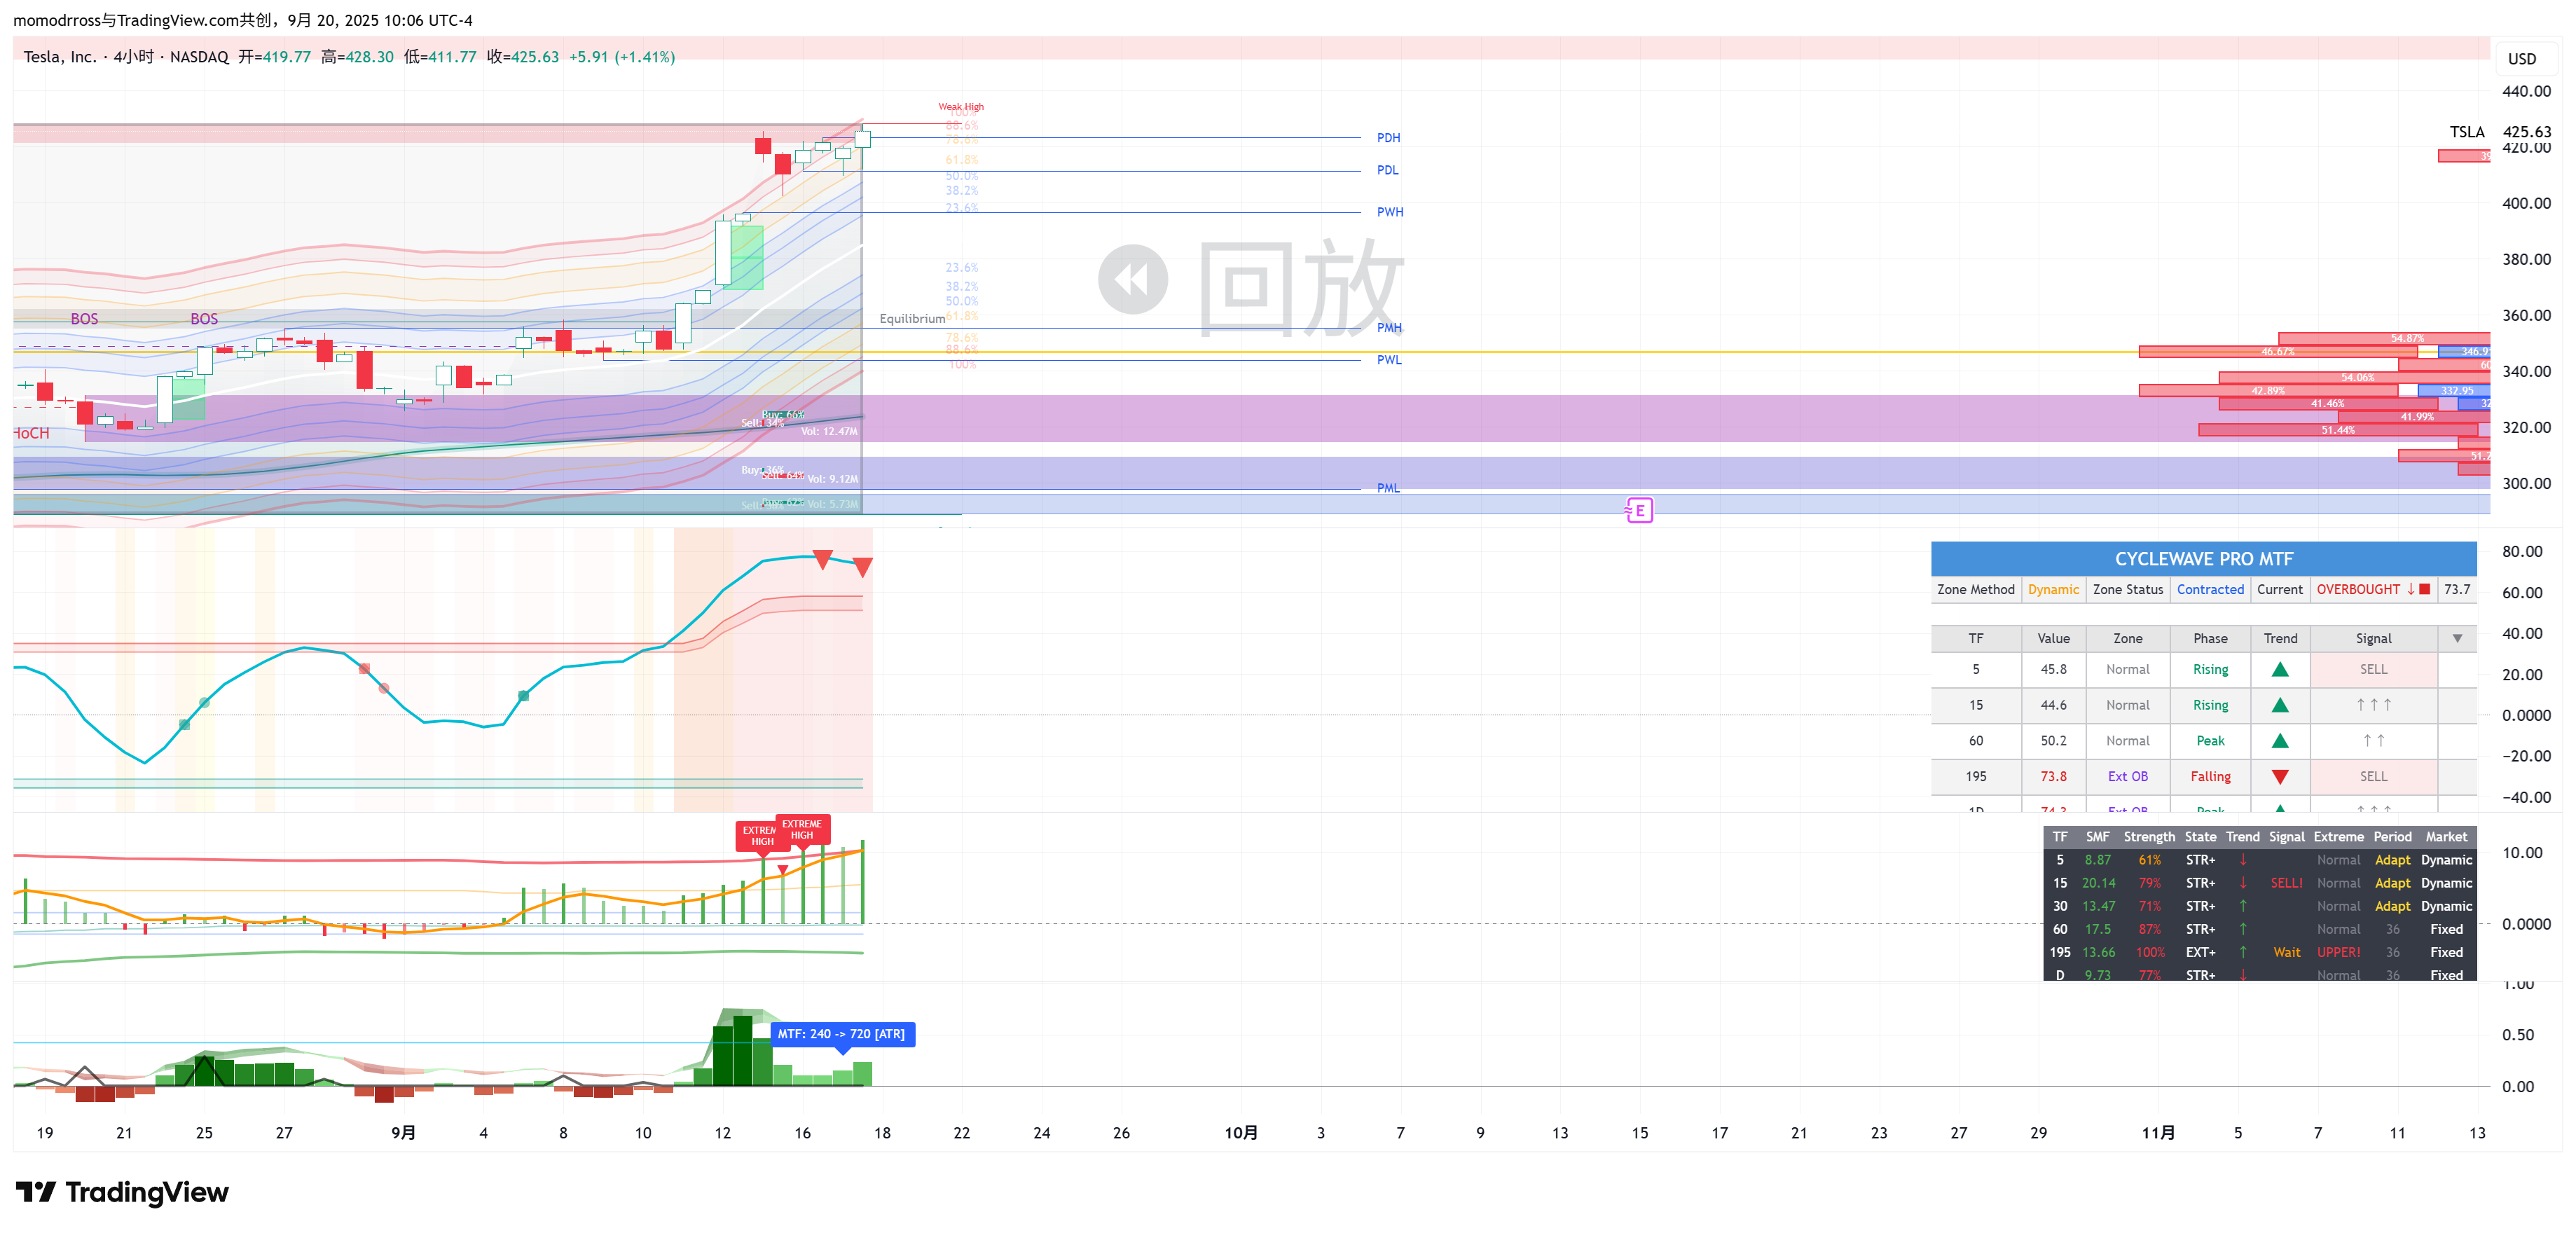
📈 MSTR Multi-Timeframe Analysis (2025-09-19)
Multi-Timeframe Signal Resonance Analysis
| Timeframe | CycleWave | SMFA | TSA | Signal Strength |
|---|---|---|---|---|
| 5-minute | BUY! | EXT- | Turning | ⭐⭐⭐ |
| 15-minute | Oversold | EXT- | Bullish Divergence | ⭐⭐⭐⭐ |
| 1-hour | Bullish Divergence | Bearish | BULL | ⭐⭐⭐⭐ |
| 4-hour | Near Oversold | EXT- | Momentum Exhaustion | ⭐⭐⭐⭐⭐ |
✅ Resonance Confirmation: 3+ out of 4 timeframes showing strong reversal signals - extremely high probability entry point
Trading Result Review
8 days later (2025-09-26) TSLA closing price at expiration: $412
- ✅ Plan A (385/375): Profit $110 (100% premium)
- ✅ Plan B (390/380): Profit $140 (100% premium)
- ✅ Plan C (400/380): Profit $367 (100% premium)
Key Success Factors:
- Put Wall ($400) support held, price never broke below
- Max Pain ($390) magnetism, price gravitated toward it at expiration
- Multi-indicator resonance entry achieved better premium
- High IV environment provided rich premium
📝 Case Summary & Insights
- Option chain analysis (Put Wall, Max Pain, etc.) provides important support references
- High IV environments are golden periods for selling strategies
- Multi-timeframe indicator resonance significantly increases success rate
- Choose appropriate strike combinations based on risk tolerance
- Even if aggressive plan succeeds, evaluate if risk-reward ratio was reasonable
Best Practices & Advanced Techniques
📚 Systematic Trading Process
Pre-Trading Preparation
- Analyze important weekly events Sunday evening (earnings, Fed meetings, etc.)
- Screen for stocks with IV Rank > 50%
- Use TSA to confirm stocks in uptrend or consolidation
- Create weekly trading plan and risk budget
Daily Monitoring
- Check overnight news and futures before market open
- Monitor SMFA and CycleWave extreme signals during trading
- Watch VIX changes and market sentiment
- Record entry reasons and expectations for each trade
Position Management
- Evaluate rolling needs 3 days before expiration
- Consider early close with 50%+ profit
- Execute stop loss decisively at predetermined levels
- Maintain detailed trading journal for review
Common Mistakes & Solutions
| Common Mistake | Consequence | Solution |
|---|---|---|
| Chasing excessive premium | Strikes too close to current price, easily breached | Maintain safety margin, prefer less profit over losses |
| Ignoring trend trading | Selling Puts in downtrends, extremely low win rate | Must wait for TSA to confirm non-downtrend |
| Overtrading | Fees erode profits, increased error probability | Trade only on high-certainty opportunities |
| No stop loss | Small losses become large, one mistake ruins multiple wins | Set stop loss at entry, execute strictly |
| Emotional trading | Revenge trading, chasing highs and selling lows | Create trading plan, execute mechanically |
Return Calculation Formula
Example: Premium $300, Margin $2000, DTE 14 days, Win Rate 80%
More Learning Resources
🎓 QuantMind Indicator Tutorials
📖 Options Knowledge Base
Start Your Put Spread Trading Journey
Recommended progression:
- Practice in paper trading account for at least 1 month
- Start with conservative plan, single trade risk under 1%
- Build trading journal, weekly review and summary
- Gradually increase position size while maintaining risk management
- Continue learning, watch for market changes and strategy optimization